Data Modelling: Difference between revisions
mNo edit summary |
|||
| Line 13: | Line 13: | ||
== UML 2 Models == | == UML 2 Models == | ||
This is an excerpt from Sparx System UML Tutorial <ref>[http://www.sparxsystems.com/resources/uml2_tutorial Sparx Systems] UML 2 Tutorials.</ref>. | |||
=== Structural Modeling Diagrams === | |||
* Package diagrams are used to divide the model into logical containers, or 'packages', and describe the interactions between them at a high level. | |||
* Class or Structural diagrams define the basic building blocks of a model: the types, classes and general materials used to construct a full model. | |||
* Object diagrams show how instances of structural elements are related and used at run-time. | |||
* Composite Structure diagrams provide a means of layering an element's structure and focusing on inner detail, construction and relationships. | |||
* Component diagrams are used to model higher level or more complex structures, usually built up from one or more classes, and providing a well defined interface. | |||
* Deployment diagrams show the physical disposition of significant artifacts within a real-world setting. | |||
* Profile diagrams provide a visual way of defining light-weight extensions to the UML specification. UML Profiles are often used to define a group of constructs with domain-specific or platform-specific properties and constraints, which extend the underlying UML elements. | |||
=== Behavioral Modeling Diagrams === | |||
Behavior diagrams capture the varieties of interaction and instantaneous states within a model as it 'executes' over time; tracking how the system will act in a real-world environment, and observing the effects of an operation or event, including its results. | |||
* Use Case diagrams are used to model user/system interactions. They define behavior, requirements and constraints in the form of scripts or scenarios. | |||
* Activity diagrams have a wide number of uses, from defining basic program flow, to capturing the decision points and actions within any generalized process. | |||
* State Machine diagrams are essential to understanding the instant to instant condition, or "run state" of a model when it executes. | |||
* Communication diagrams show the network, and sequence, of messages or communications between objects at run-time, during a collaboration instance. | |||
* Sequence diagrams are closely related to communication diagrams and show the sequence of messages passed between objects using a vertical timeline. | |||
* Timing diagrams fuse sequence and state diagrams to provide a view of an object's state over time, and messages which modify that state. | |||
* Interaction Overview diagrams fuse activity and sequence diagrams to allow interaction fragments to be easily combined with decision points and flows. | |||
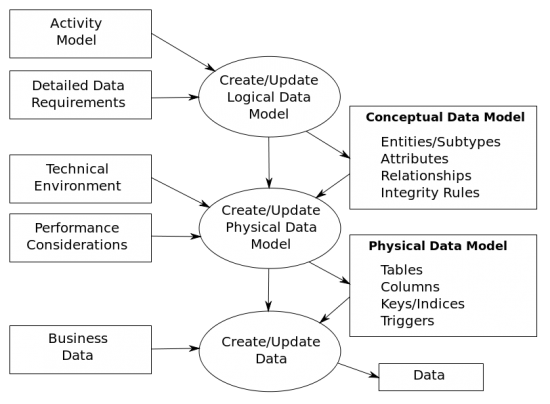
[[image:Data_Modelling_Overview.png|thump|550px|right|Data | [[image:Data_Modelling_Overview.png|thump|550px|right|Data Modeling Overview]] | ||
== Tools == | == Tools == | ||
Revision as of 13:24, 23 August 2014
Data Modelling in software engineering is the process of creating a data model for an information system by applying formal data modelling techniques [1].
Data modeling is a process used to define and analyze data requirements needed to support the business processes within the scope of corresponding information systems in organizations. Therefore, the process of data modeling involves professional data modelers working closely with business stakeholders, as well as potential users of the information system. There are three different types of data models produced while progressing from requirements to the actual database to be used for the information system.
Strategic Concepts
UML 2 Models
This is an excerpt from Sparx System UML Tutorial [2].
Structural Modeling Diagrams
- Package diagrams are used to divide the model into logical containers, or 'packages', and describe the interactions between them at a high level.
- Class or Structural diagrams define the basic building blocks of a model: the types, classes and general materials used to construct a full model.
- Object diagrams show how instances of structural elements are related and used at run-time.
- Composite Structure diagrams provide a means of layering an element's structure and focusing on inner detail, construction and relationships.
- Component diagrams are used to model higher level or more complex structures, usually built up from one or more classes, and providing a well defined interface.
- Deployment diagrams show the physical disposition of significant artifacts within a real-world setting.
- Profile diagrams provide a visual way of defining light-weight extensions to the UML specification. UML Profiles are often used to define a group of constructs with domain-specific or platform-specific properties and constraints, which extend the underlying UML elements.
Behavioral Modeling Diagrams
Behavior diagrams capture the varieties of interaction and instantaneous states within a model as it 'executes' over time; tracking how the system will act in a real-world environment, and observing the effects of an operation or event, including its results.
- Use Case diagrams are used to model user/system interactions. They define behavior, requirements and constraints in the form of scripts or scenarios.
- Activity diagrams have a wide number of uses, from defining basic program flow, to capturing the decision points and actions within any generalized process.
- State Machine diagrams are essential to understanding the instant to instant condition, or "run state" of a model when it executes.
- Communication diagrams show the network, and sequence, of messages or communications between objects at run-time, during a collaboration instance.
- Sequence diagrams are closely related to communication diagrams and show the sequence of messages passed between objects using a vertical timeline.
- Timing diagrams fuse sequence and state diagrams to provide a view of an object's state over time, and messages which modify that state.
- Interaction Overview diagrams fuse activity and sequence diagrams to allow interaction fragments to be easily combined with decision points and flows.

Tools
- Sybase PowerDesigner
- Embarcadero ER/Studio
- Oracle Designer
- Silverrun
- Sparx Systems Enterprise Architect (Windows, Mac OSX with CodeWeavers CrossOver).
See also
Reference
- ↑ Wikipedia Data Modelling
- ↑ Sparx Systems UML 2 Tutorials.