Data Modelling
Data Modelling in software engineering is the process of creating a data model for an information system by applying formal data modelling techniques [1].
Data modeling is a process used to define and analyze data requirements needed to support the business processes within the scope of corresponding information systems in organizations. Therefore, the process of data modeling involves professional data modelers working closely with business stakeholders, as well as potential users of the information system. There are three different types of data models produced while progressing from requirements to the actual database to be used for the information system.
Strategic Concepts
UML 2 Models
This is an excerpt from Sparx System UML Tutorial [2].
Structural Modeling Diagrams
- Package Diagrams are used to divide the model into logical containers, or 'packages', and describe the interactions between them at a high level.
- Class or Structural diagrams define the basic building blocks of a model: the types, classes and general materials used to construct a full model.
- Object diagrams show how instances of structural elements are related and used at run-time.
- Composite Structure diagrams provide a means of layering an element's structure and focusing on inner detail, construction and relationships.
- Component diagrams are used to model higher level or more complex structures, usually built up from one or more classes, and providing a well defined interface.
- Deployment diagrams show the physical disposition of significant artifacts within a real-world setting.
- Profile diagrams provide a visual way of defining light-weight extensions to the UML specification. UML Profiles are often used to define a group of constructs with domain-specific or platform-specific properties and constraints, which extend the underlying UML elements.
=== Communication Diagrams A communication diagram, formerly called a collaboration diagram, is an interaction diagram that shows similar information to sequence diagrams but its primary focus is on object relationships.
On communication diagrams, objects are shown with association connectors between them. Messages are added to the associations and show as short arrows pointing in the direction of the message flow. The sequence of messages is shown through a numbering scheme.
The following two diagrams show a communication diagram and the sequence diagram that shows the same information. Although it is possible to derive the sequencing of messages in the communication diagram from the numbering scheme, it isn’t immediately visible. What the communication diagram does show quite clearly though, is the full set of messages passed between adjacent objects.
Behavioral Modeling Diagrams
Behavior diagrams capture the varieties of interaction and instantaneous states within a model as it 'executes' over time; tracking how the system will act in a real-world environment, and observing the effects of an operation or event, including its results.
- Use Case diagrams are used to model user/system interactions. They define behavior, requirements and constraints in the form of scripts or scenarios.
- Activity diagrams have a wide number of uses, from defining basic program flow, to capturing the decision points and actions within any generalized process.
- State Machine diagrams are essential to understanding the instant to instant condition, or "run state" of a model when it executes.
- Communication diagrams show the network, and sequence, of messages or communications between objects at run-time, during a collaboration instance.
- Sequence diagrams are closely related to communication diagrams and show the sequence of messages passed between objects using a vertical timeline.
- Timing diagrams fuse sequence and state diagrams to provide a view of an object's state over time, and messages which modify that state.
- Interaction Overview diagrams fuse activity and sequence diagrams to allow interaction fragments to be easily combined with decision points and flows.

Package Diagrams
Package diagrams are used to reflect the organization of packages and their elements. When used to represent class elements, package diagrams provide a visualization of the namespaces. The most common use for package diagrams is to organize use case diagrams and class diagrams, although the use of package diagrams is not limited to these UML elements.
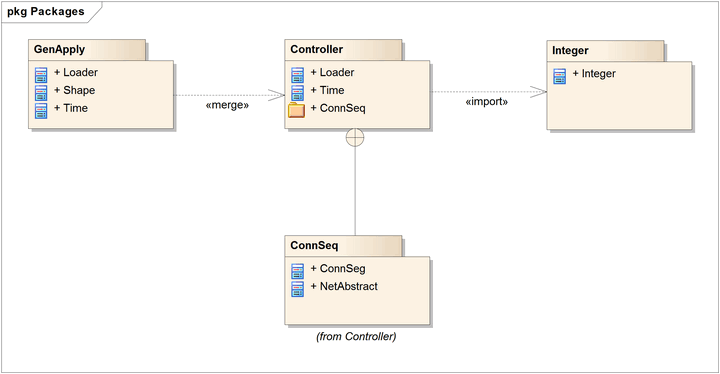
Example Package Diagram. More...
Class Diagrams
The class diagram shows the building blocks of any object-orientated system. Class diagrams depict a static view of the model, or part of the model, describing what attributes and behavior it has rather than detailing the methods for achieving operations. Class diagrams are most useful in illustrating relationships between classes and interfaces. Generalizations, aggregations, and associations are all valuable in reflecting inheritance, composition or usage, and connections respectively.
The diagram below illustrates aggregation relationships between classes. The lighter aggregation indicates that the class "Account" uses AddressBook, but does not necessarily contain an instance of it. The strong, composite aggregations by the other connectors indicate ownership or containment of the source classes by the target classes, for example Contact and ContactGroup values will be contained in AddressBook.
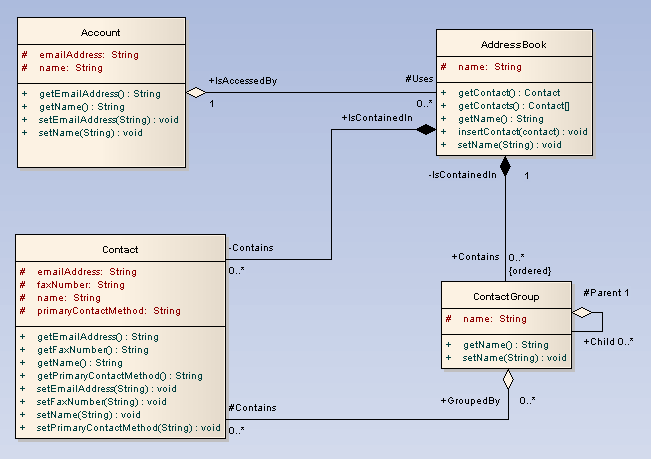
Example Class Diagram. More...
Object Diagrams
An object diagram may be considered a special case of a class diagram. Object diagrams use a subset of the elements of a class diagram in order to emphasize the relationship between instances of classes at some point in time. They are useful in understanding class diagrams. They don’t show anything architecturally different to class diagrams, but reflect multiplicity and roles.
Composite Diagrams
A composite structure diagram is a diagram that shows the internal structure of a classifier, including its interaction points to other parts of the system. It shows the configuration and relationship of parts, that together, perform the behavior of the containing classifier.
Class
Class elements have been described in great detail in the section on class diagrams. This section describes the way classes can be displayed as composite elements exposing interfaces and containing ports and parts.

Example Class Composite. More...
Part
A part is an element that represents a set of one or more instances which are owned by a containing classifier instance. So for example, if a diagram instance owned a set of graphical elements, then the graphical elements could be represented as parts; if it were useful to do so, to model some kind of relationship between them. Note that a part can be removed from its parent before the parent is deleted, so that the part isn't deleted at the same time.
A part is shown as an unadorned rectangle contained within the body of a class or component element.

Example Part Cpmposite.
Component Diagrams
Component diagrams illustrate the pieces of software, embedded controllers, etc., that will make up a system. A component diagram has a higher level of abstraction than a Class Diagram - usually a component is implemented by one or more classes (or objects) at runtime. They are building blocks so a component can eventually encompass a large portion of a system.

Example Component Diagram. More...
Deployment Diagrams
A deployment diagram models the run-time architecture of a system. It shows the configuration of the hardware elements (nodes) and shows how software elements and artifacts are mapped onto those nodes. Node A Node is either a hardware or software element. It is shown as a three-dimensional box shape, as shown below.

Example Node. More...
Use Case Model
The use case model captures the requirements of a system. Use cases are a means of communicating with users and other stakeholders what the system is intended to do. Actors A use case diagram shows the interaction between the system and entities external to the system. These external entities are referred to as actors. Actors represent roles which may include human users, external hardware or other systems. An actor is usually drawn as a named stick figure, or alternatively as a class rectangle with the «actor» keyword.
Example: Use Case Model. More...
Activity Diagrams
In UML, an activity diagram is used to display the sequence of activities. Activity diagrams show the workflow from a start point to the finish point detailing the many decision paths that exist in the progression of events contained in the activity. They may be used to detail situations where parallel processing may occur in the execution of some activities. Activity diagrams are useful for business modeling where they are used for detailing the processes involved in business activities.

Example Activity Diagram. More...
State Machine Diagrams
A state machine diagram models the behavior of a single object, specifying the sequence of events that an object goes through during its lifetime in response to events.

Example: State Machine Diagram. More...
Sequence Diagrams
A sequence diagram is a form of interaction diagram which shows objects as lifelines running down the page, with their interactions over time represented as messages drawn as arrows from the source lifeline to the target lifeline. Sequence diagrams are good at showing which objects communicate with which other objects; and what messages trigger those communications. Sequence diagrams are not intended for showing complex procedural logic.

Example: Sequence Diagram. More...
Tools
- Astah, A free recommended modelling tool
- Sybase PowerDesigner
- Embarcadero ER/Studio
- Oracle Designer
- Silverrun
- Sparx Systems Enterprise Architect (Windows, Mac OSX with CodeWeavers CrossOver).
See also
Reference
- ↑ Wikipedia Data Modelling
- ↑ Sparx Systems UML 2 Tutorials.