Corona COVID-19
Introduction - Inleiding
| Corona COVID-19 Introduction | Corona COVID-19 Inleiding |
|---|---|
|
The Corona COVID-19 Website is Desktop Application for showing the latest Data & Graphs for the COVID-19 decease.
|
De Corona COVID-19 Website is Desktop Applicatie, die de laatste gegevens en grafieken over de COVID-19 uitbraak toont.
|
Purpose - Doel
| Website/App Purpose | Doel van de website/Applicatie |
|---|---|
|
The main purpose is comparison of the course of the disease in different countries. The comparison is based on individual country reports of new cases, deaths, recoveries. At this moment there are 2 ways to compare:
If someone has suggestions for more or better comparison please contact the webmaster (See the mail-icon in the footer left below). |
Het hoofddoel is de vergelijking van het verloop van de ziekte in verschillende landen. De vergelijking is gebaseerd op de individuele rapportage door de landen van nieuwe gevallen, overlijdens, herstellingen. Op dit moment bestaat de vergelijking uit:
Als iemand suggesties heeft voor andere vergelijkingen, stuur dan een email naar de Webmaster. Gebruik hiervoor het mail-icon in de voettekst links onder. |
Menu
| Menu | Menu |
|---|---|
|
The menu has 6 main topics
|
Het menu heeft 5 hoofdonderwerpen
|
CBS: Centraal Bureau voor Statistiek (Dutch/Nederlands).
Home
| Home | Home |
|---|---|
The Home-tabpage explains the in brief the goal of the application in 3 chapters:
|
De Home-tab legt in het kort het doel van de applicatie uit.
|
Tables - Tabellen
| Tables | Tabellen |
|---|---|
Tables WHO implements 2 tables which compare data on 6 selected countries (selection to be made in the Prefs tab):
|
De WHO tabellen implementeren 2 tabellen met vergelijking over 6 geselecteerde landen (selectie wordt gemaakt in de Voorkeuren tab):
|
Graphs - Grafieken
WHO Graphs - Grafieken
| Graphs | Grafieken | |
|---|---|---|
There are 3 different comparison graphs:
|
Er zijn 3 verschillende vergelijkingsgrafieken:
| |
| Please note not every country reports each of the 3 items. | Houd er rekening mee dat niet ieder land elk onderwerp rapporteert. |
Death/Doden / 100.000
| Graphs | Grafieken |
|---|---|
| The graph shows the total deaths per country per 100.000 inhabitants on the last reported data date. | De grafiek toont de totale sterfte per land per 100.000 inwoners op de laatste rapportage gegevens datum. |
CBS vs RIVM Graph - Grafieken
| Graphs | Grafieken |
|---|---|
| The Dutch Central Bureau of Statistics (CBS) registers all deaths in the Netherlands. So it produces statistical Data on the average amount of death and reports per weekly a list.
The data of the CBS is compared with the reports of the National Institute for Health and Environment, NL: Rijks Instituut voor Volksgezondheid en Milieu, (RIVM). In the beginning of the COVID-19 crisis the list shows a great difference, but the last month the reports shows very little difference. Therefor the list is no longer updated. |
Het Centraal Bureau voor Statistiek (CBS) registrert all overledenen in Nederland en produceert statistische gegevens over de gemiddelde sterfte in weekrapporten.
Deze gegevens worden vergeleken met die van het Rijks Instituut voor Volksgezondheid en Milieu, (RIVM). In het begin van de COVID-19 crises verschilde deze getallen aanzienlijk, maar de laatste tijd is er nauwelijk verschil. Daarom wordt de lijst niet meer bijgehouden. |
Analysis - Analyse
| Analysis | Analyse | ||||||||||||||||||
|---|---|---|---|---|---|---|---|---|---|---|---|---|---|---|---|---|---|---|---|
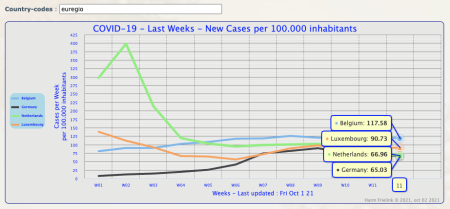
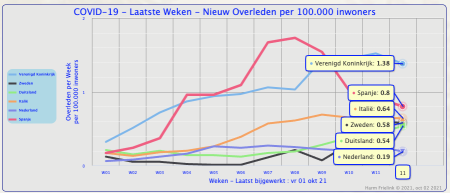
| The Analysis section shows sortable tables/list (Datatables) and graphs for New-Cases/Deaths and over the last 12 weeks.
The Data is on-line on the fly selectable per countries. Shortcuts have been made to make comparison easier, meaning:
* Parts: Not all countries are included.
The tables above show the DataTables tabs where:
|
De Analyse tabbladen tonen door de gebruiker te sorteren tabellen/lijsten (Datatables) en grafieken voor Nieuwe Gevallen/Overledenen over de laatste 12 weken.
De gegevens zijn on-line on-the-fly selecteerbaar per land. Er zijn snelkoppelingen gemaakt om het vergelijken gemakkelijker te maken.
* Deels: Niet alle landen zijn inbegrepen.
| ||||||||||||||||||
| There is a common input field for choosing the countries in New Cases and Deceased. | Er is een gezamenlijk invoerveld voor de keuze van de landen in Nieuwe Gevallen en Overledenen. | ||||||||||||||||||
Prefs - Voorkeuren
| Preferences | Voorkeuren |
|---|---|
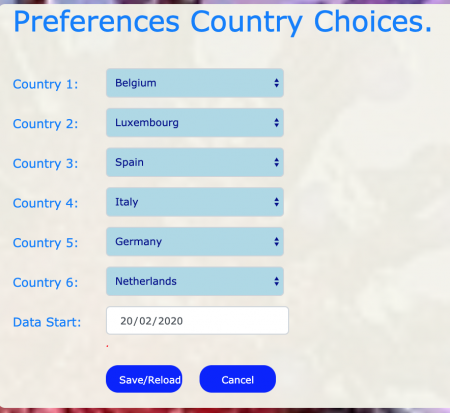
User preferences can be filled to select your own tables and graphs.
The Save/Reload button will be only working when you fulfill on all requirements. On success the website will reload and the new selection is available in the Tables and Graph sections. |
Gebruikers voorkeuren kunnen worden gespecificeerd voor het samenstellen van eigen tablellen en grafieken.
De Bewaren knop zal alleen functioneren als aan genoemde voorwaarden is voldaan. Bij succesvol invoeren wordt de website opnieuw gestart met de gewijzigde gegevens in de tab-bladen. |
Help
| Help | Help |
|---|---|
| The Wiki-Website is this explanation. | De Wiki-Website is deze uitleg. |
| The FAQ contains the most common questions.
The user is free to ask question to the webmaster. The webmaster places a question that is asked more than once, in the FAQ. |
De FAQ bevat de meest voorkomende vragen.
Het staat iedere gebruiker vrij om vragen aan de webmaster te stellen. Vragen die meerdere malen gesteld worden, worden opgenomen in de FAQ. |
| The Reload Website reloads the website. Reloading is necessary to refresh the new data into the website or to load the changed preferences of the user. | De Ververs Website herlaadt de website. Herladen is noodzakelijk om de nieuwe gegevens te verversen of om gewijzigde gebruiker voorkeuren te laden. |
| About shows information on Website, Webmaster and Versioning. | Over geeft informatie over Website, Webmaster en Versie. |
Abbreviations - Afkortingen
| Abbreviations | Afkortingen |
|---|---|
| New cases is the name for new infections in humans. | Nieuwe gevallen is de benaming voor nieuwe besmettingen bij mensen. |
| CBS (Centraal Bureau Statistiek): Statistics Netherlands (CBS) | CBS (Centraal Bureau Statistiek): Het Centraal Bureau voor de Statistiek (CBS) maakt het mogelijk dat maatschappelijke debatten gevoerd kunnen worden op basis van betrouwbare statistische informatie. |
| Coronaviruses are a group of related viruses that cause diseases in mammals and birds. | Coronavirussen zijn een onderfamilie van virussen met positief enkelstrengig RNA als genetisch materiaal. Ze danken hun naam aan de krans (Latijn: corona) rond de virusdeeltjes. |
| COVID-19 is one of the Coronaviruses and causes the global disaster since 2019. | COVID-19 is een van de Coronavirussen en veroorzaakt de huidige pandemie sinds 2019. |
| Rijksinstituut voor Volksgezondheid en Milieu, RIVM, (EN: National Institute for Health and Environment) is a Dutch Government Institute that monitors the Corona Crisis and advices the Dutch Government. | Het Rijksinstituut voor Volksgezondheid en Milieu RIVM monitoort de COVID-19 crises en adviseert de nederlandse regering. |
| WHO (World Health Organization): Global Health Organization is the health-part of the United Nations Organization (UNO). | WHO (World Health Organization): Wereld Gezondheid Organisatie is het gezondheidsonderdeel van de Verenigde Naties. |


